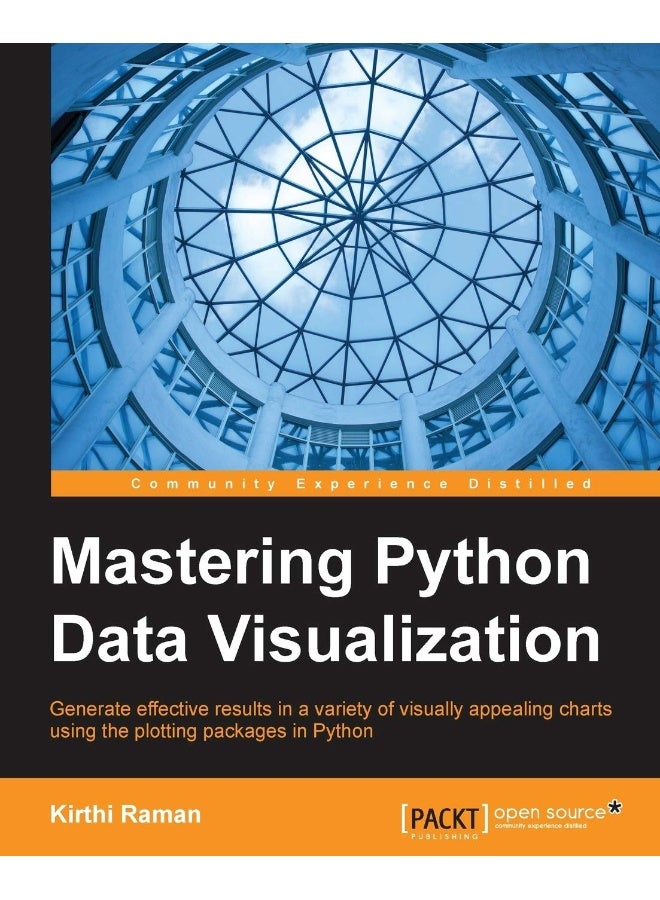
| وصف الكتاب | Generate effective results in a variety of visually appealing charts using the plotting packages in PythonKey Features: Explore various tools and their strengths while building meaningful representations that can make it easier to understand dataPacked with computational methods and algorithms in diverse fields of scienceWritten in an easy-to-follow categorical style, this book discusses some niche techniques that will make your code easier to work with and reuseBook Description: Python has a handful of open source libraries for numerical computations involving optimization, linear algebra, integration, interpolation, and other special functions using array objects, machine learning, data mining, and plotting. Pandas have a productive environment for data analysis. These libraries have a specific purpose and play an important role in the research into diverse domains including economics, finance, biological sciences, social science, health care, and many more. The variety of tools and approaches available within Python community is stunning, and can bolster and enhance visual story experiences.This book offers practical guidance to help you on the journey to effective data visualization. Commencing with a chapter on the data framework, which explains the transformation of data into information and eventually knowledge, this book subsequently covers the complete visualization process using the most popular Python libraries with working examples. You will learn the usage of Numpy, Scipy, IPython, MatPlotLib, Pandas, Patsy, and Scikit-Learn with a focus on generating results that can be visualized in many different ways. Further chapters are aimed at not only showing advanced techniques such as interactive plotting; numerical, graphical linear, and non-linear regression; clustering and classification, but also in helping you understand the aesthetics and best practices of data visualization. The book concludes with interesting examples such as social networks, directed graph examples in real-life, data structures appropriate for these problems, and network analysis.By the end of this book, you will be able to effectively solve a broad set of data analysis problems.What You Will Learn: Gather, cleanse, access, and map data to a visual frameworkRecognize which visualization method is applicable and learn best practices for data visualizationGet acquainted with reader-driven narratives and author-driven narratives and the principles of perceptionUnderstand why Python is an effective tool to be used for numerical computation much like MATLAB, and explore some interesting data structures that come with itExplore with various visualization choices how Python can be very useful in computation in the field of finance and statisticsGet to know why Python is the second choice after Java, and is used frequently in the field of machine learningCompare Python with other visualization approaches using Julia and a JavaScript-based framework such as D3.jsDiscover how Python can be used in conjunction with NoSQL such as Hive to produce results efficiently in a distributed environmentWho this book is for: |
 استرجاع مجاني وسهل
 أفضل العروض


![/electronics-and-mobiles/mobiles-and-accessories/mobiles-20905/smartphones/honor/?sort[by]=best_rating&sort[dir]=desc&limit=50&page=1&isCarouselView=false](https://a.nooncdn.com/cms/pages/20250811/honor/en_uae_dk-nav-01.png)


![/fashion-men/jack_jones/?sort[by]=popularity&sort[dir]=desc&limit=50](https://a.nooncdn.com/cms/pages/20240305/4ef48af441e2b44cea1673cd2e4aff67/en_dk-men-brands-04.png)


![/fashion-men/seventy_five/?sort[by]=popularity&sort[dir]=desc&limit=50](https://a.nooncdn.com/cms/pages/20240305/4ef48af441e2b44cea1673cd2e4aff67/en_dk-womens-new-brands-01.png)
![/fashion-men/skechers/?sort[by]=popularity&sort[dir]=desc&limit=50](https://a.nooncdn.com/cms/pages/20240305/4ef48af441e2b44cea1673cd2e4aff67/en_dk-womens-new-brands-02.png)


![/fashion-women/mango/?sort[by]=popularity&sort[dir]=desc&limit=50](https://a.nooncdn.com/cms/pages/20240305/4ef48af441e2b44cea1673cd2e4aff67/en_dk-women-brands-05.png)
![/fashion-women/guess/?sort[by]=popularity&sort[dir]=desc&limit=50](https://a.nooncdn.com/cms/pages/20240305/4ef48af441e2b44cea1673cd2e4aff67/en_dk-women-brands-09.png)


![/fashion-women/ella/?sort[by]=popularity&sort[dir]=desc&limit=50](https://a.nooncdn.com/cms/pages/20241812/en_dk-nav-brands-01.png)
![/fashion-women/skechers/?sort[by]=popularity&sort[dir]=desc&limit=50](https://a.nooncdn.com/cms/pages/20241812/en_dk-nav-brands-02.png)


![/fashion/view-all-kids-clothing/nike/?sort[by]=popularity&sort[dir]=desc&limit=50](https://a.nooncdn.com/cms/pages/20240911/nav-web/en_mb_uae_brand-01.png)
![/fashion/view-all-kids-clothing/disney/disney_minnie_mouse/disney_frozen/disney_princess/disney_mickey_mouse/disney_baby/?sort[by]=popularity&sort[dir]=desc&limit=50](https://a.nooncdn.com/cms/pages/20240911/nav-web/en_mb_uae_brand-03.png)


![/fashion/view-all-kids-clothing/new_balance/?sort[by]=popularity&sort[dir]=desc&limit=50](https://a.nooncdn.com/cms/pages/20240911/nav-web/en_mb_uae_brand-11.png)


![/music-movies-and-tv-shows/musical-instruments-24670/pianos-keyboards-synthesizers/chloris/?sort[by]=popularity&sort[dir]=desc&limit=50&page=1&isCarouselView=false](https://f.nooncdn.com/cms/pages/20250407/books-nav/en_uae_dk-nav-brands-04.png)
![/music-movies-and-tv-shows/musical-instruments-24670/pianos-keyboards-synthesizers/roland/?sort[by]=popularity&sort[dir]=desc&limit=50&page=1&isCarouselView=false](https://f.nooncdn.com/cms/pages/20250407/books-nav/en_uae_dk-nav-brands-05.png)
![/music-movies-and-tv-shows/musical-instruments-24670/pianos-keyboards-synthesizers/donner/?sort[by]=popularity&sort[dir]=desc&limit=50&page=1&isCarouselView=false](https://f.nooncdn.com/cms/pages/20250407/books-nav/en_uae_dk-nav-brands-06.png)
![/music-movies-and-tv-shows/musical-instruments-24670/pianos-keyboards-synthesizers/korg/?sort[by]=popularity&sort[dir]=desc&limit=50&page=1&isCarouselView=false](https://f.nooncdn.com/cms/pages/20250407/books-nav/en_uae_dk-nav-brands-07.png)


