استرجاع مجاني وسهل
أفضل العروض


| الناشر | John Wiley And Sons Inc |
| اللغة | الإنجليزية |
| عن المؤلف | KUNIO TAKEZAWA, PhD, is Research Scientist in the Department of Information Science and Technology at the National Agricultural Research Center (Japan) and Associate Professor in the Cooperative Graduate School System at the University of Tsukuba (Japan). He has published numerous journal articles in his areas of research interest, which include nonparametric regression, smoothing methods, and fuzzy estimation. Dr. Takezawa is the author of Introduction to Nonparametric Regression, also published by Wiley. |
| عدد الصفحات | 278 |
| تنسيق الكتاب | غلاف ورقي |
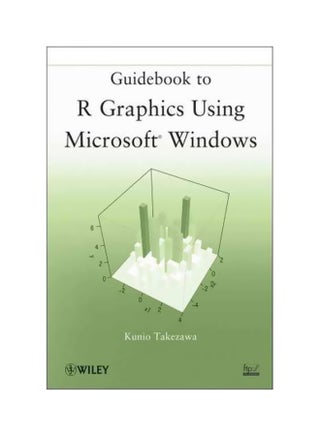
| وصف الكتاب | This book introduces the graphical capabilities of R to readers new to the software, taking readers step by step through the process of creating histograms, boxplots, strip charts, time series graphs, steam-and-leaf displays, scatterplot matrices, and map graphs. Throughout the book, concise explanations of key concepts of R graphics assist readers in carrying out the presented procedures. The discussed techniques are accompanied by a wealth of screenshots and graphics with related R code available on the book's FTP site, and numerous exercises allow readers to test their understanding of the presented material. |
| تاريخ النشر | 30-May-12 |

