استرجاع مجاني وسهل
 أفضل العروض

| الناشر | Vinaitheerthan Renganathan |
| رقم الكتاب المعياري الدولي 13 | 9781393996347 |
| رقم الكتاب المعياري الدولي 10 | 1393996345 |
| الكاتب | Vinaitheerthan Renganathan |
| تنسيق الكتاب | Paperback |
| اللغة | English |
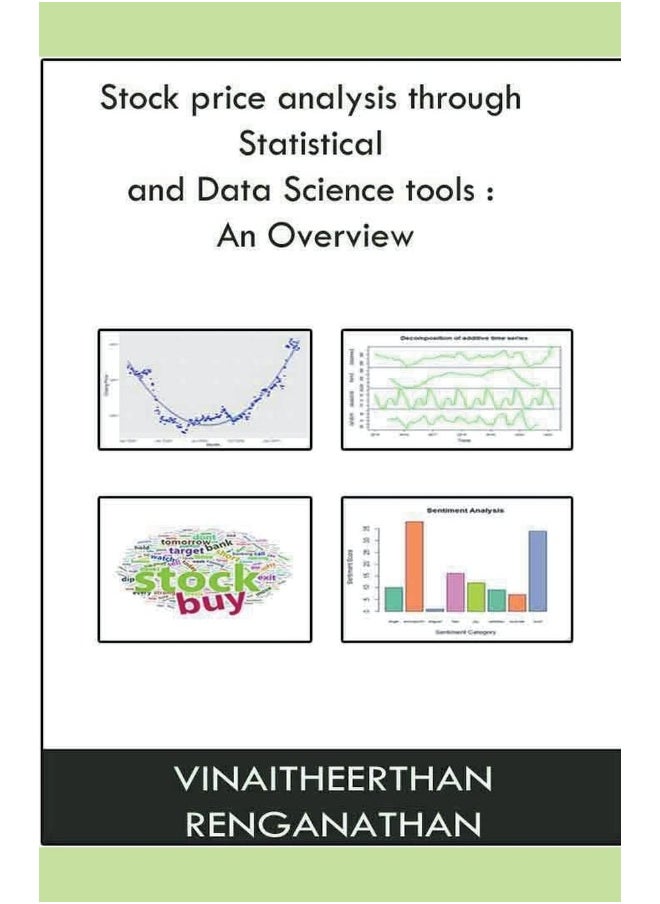
| وصف الكتاب | Stock price analysis involves different methods such as fundamental analysis and technical analysis which is based on data related to price movement of the stock in the past. Price of the stock is affected by various factors such as company's performance, current status of economy and political factor. These factors play an important role in supply and demand of the stock which makes the price to be volatile in the short term. Investors and stock traders aim to book profit through buying and selling the stocks. There are different statistical and data science tools are being used to predict the stock price.Data Science and Statistical tools assume only the stock price's historical data in predicting the future stock price. Statistical tools include measures such as Graph and Charts which depicts the general trend and time series tools such as Auto Regressive Integrated Moving Averages (ARIMA) and regression analysis. Data Science tools include models like Decision Tree, Support Vector Machine (SVM), Artificial Neural Network (ANN) and Long Term and Short Term Memory (LSTM) Models.Current methods include carrying out sentiment analysis of tweets, comments and other social media discussion to extract the hidden sentiment expressed by the users which indicate the positive or negative sentiment towards the stock price and the company.The book provides an overview of the analyzing and predicting stock price movements using statistical and data science tools using R open source software with hypothetical stock data sets. It provides a short introduction to R software to enable the user to understand analysis part in the later part.The book will not go into details of suggesting when to purchase a stock or what at price. The tools presented in the book can be used as a guiding tool in decision making while buying or selling the stock.Vinaitheerthan Renganathan |
| عن المؤلف | Statistician and Data Scientist with 26 years of experience in the field of Clincal,Manufacturing, Quality Assurance and Marketing Research. |
| تاريخ النشر | 30 April 2021 |
| عدد الصفحات | 150 pages |


![/fashion-men/jack_jones/?sort[by]=popularity&sort[dir]=desc&limit=50](https://a.nooncdn.com/cms/pages/20240305/4ef48af441e2b44cea1673cd2e4aff67/en_dk-men-brands-04.png)


![/fashion-men/seventy_five/?sort[by]=popularity&sort[dir]=desc&limit=50](https://a.nooncdn.com/cms/pages/20240305/4ef48af441e2b44cea1673cd2e4aff67/en_dk-womens-new-brands-01.png)
![/fashion-men/skechers/?sort[by]=popularity&sort[dir]=desc&limit=50](https://a.nooncdn.com/cms/pages/20240305/4ef48af441e2b44cea1673cd2e4aff67/en_dk-womens-new-brands-02.png)


![/fashion-women/mango/?sort[by]=popularity&sort[dir]=desc&limit=50](https://a.nooncdn.com/cms/pages/20240305/4ef48af441e2b44cea1673cd2e4aff67/en_dk-women-brands-05.png)
![/fashion-women/guess/?sort[by]=popularity&sort[dir]=desc&limit=50](https://a.nooncdn.com/cms/pages/20240305/4ef48af441e2b44cea1673cd2e4aff67/en_dk-women-brands-09.png)


![/fashion-women/ella/?sort[by]=popularity&sort[dir]=desc&limit=50](https://a.nooncdn.com/cms/pages/20241812/en_dk-nav-brands-01.png)
![/fashion-women/skechers/?sort[by]=popularity&sort[dir]=desc&limit=50](https://a.nooncdn.com/cms/pages/20241812/en_dk-nav-brands-02.png)


![/fashion/view-all-kids-clothing/nike/?sort[by]=popularity&sort[dir]=desc&limit=50](https://a.nooncdn.com/cms/pages/20240911/nav-web/en_mb_uae_brand-01.png)
![/fashion/view-all-kids-clothing/disney/disney_minnie_mouse/disney_frozen/disney_princess/disney_mickey_mouse/disney_baby/?sort[by]=popularity&sort[dir]=desc&limit=50](https://a.nooncdn.com/cms/pages/20240911/nav-web/en_mb_uae_brand-03.png)


![/fashion/view-all-kids-clothing/new_balance/?sort[by]=popularity&sort[dir]=desc&limit=50](https://a.nooncdn.com/cms/pages/20240911/nav-web/en_mb_uae_brand-11.png)


![/music-movies-and-tv-shows/musical-instruments-24670/pianos-keyboards-synthesizers/chloris/?sort[by]=popularity&sort[dir]=desc&limit=50&page=1&isCarouselView=false](https://f.nooncdn.com/cms/pages/20250407/books-nav/en_uae_dk-nav-brands-04.png)
![/music-movies-and-tv-shows/musical-instruments-24670/pianos-keyboards-synthesizers/roland/?sort[by]=popularity&sort[dir]=desc&limit=50&page=1&isCarouselView=false](https://f.nooncdn.com/cms/pages/20250407/books-nav/en_uae_dk-nav-brands-05.png)
![/music-movies-and-tv-shows/musical-instruments-24670/pianos-keyboards-synthesizers/donner/?sort[by]=popularity&sort[dir]=desc&limit=50&page=1&isCarouselView=false](https://f.nooncdn.com/cms/pages/20250407/books-nav/en_uae_dk-nav-brands-06.png)
![/music-movies-and-tv-shows/musical-instruments-24670/pianos-keyboards-synthesizers/korg/?sort[by]=popularity&sort[dir]=desc&limit=50&page=1&isCarouselView=false](https://f.nooncdn.com/cms/pages/20250407/books-nav/en_uae_dk-nav-brands-07.png)