استرجاع مجاني وسهل
 أفضل العروض

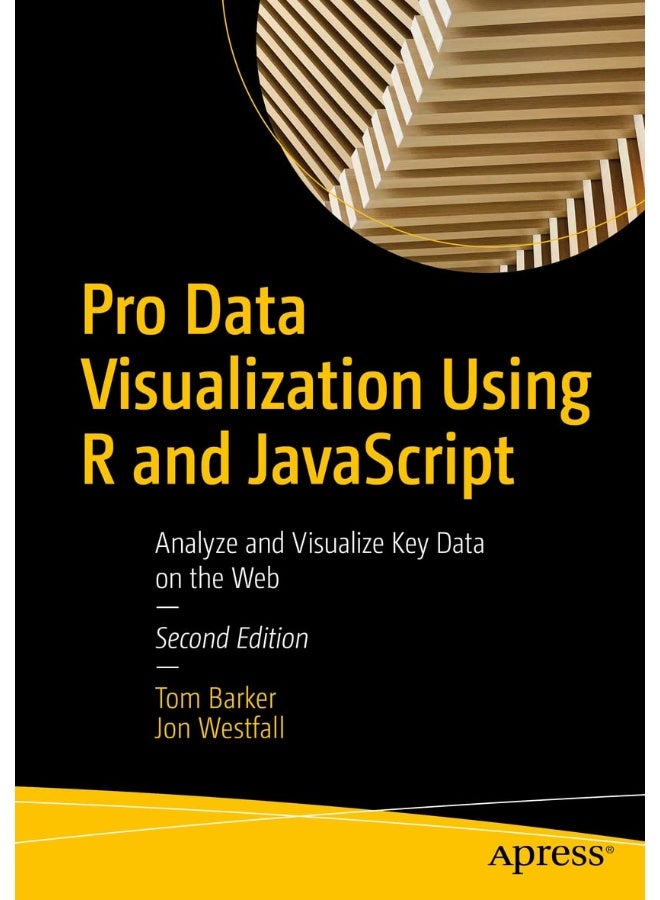


| الناشر | Apress; 2nd ed. edition |
| رقم الكتاب المعياري الدولي 10 | 1484272013 |
| وصف الكتاب | Use R 4, RStudio, Tidyverse, and Shiny to interrogate and analyze your data, and then use the D3 JavaScript library to format and display that data in an elegant, informative, and interactive way. You will learn how to gather data effectively, and also how to understand the philosophy and implementation of each type of chart, so as to be able to represent the results visually.With the popularity of the R language, the art and practice of creating data visualizations is no longer the preserve of mathematicians, statisticians, or cartographers. As technology leaders, we can gather metrics around what we do and use data visualizations to communicate that information. Pro Data Visualization Using R and JavaScript combines the power of the R language with the simplicity and familiarity of JavaScript to display clear and informative data visualizations.Gathering and analyzing empirical data is the key to truly understanding anything. We can track operational metrics to quantify the health of our products in production. We can track quality metrics of our projects, and even use our data to identify bad code. Visualizing this data allows anyone to read our analysis and easily get a deep understanding of the story the data tells. This book makes the R language approachable, and promotes the idea of data gathering and analysis mostly using web interfaces.What You Will LearnCarry out data visualization using R and JavaScriptUse RStudio for data visualization Harness Tidyverse data pipelinesApply D3 and R Notebooks towards your data Work with the R Plumber API generator, Shiny, and moreWho This Book Is ForProgrammers and data scientists/analysts who have some prior experience with R and JavaScript. |
| تنسيق الكتاب | Paperback |
| تاريخ النشر | 8 October 2021 |
| رقم الكتاب المعياري الدولي 13 | 9781484272015 |
| عن المؤلف | Tom Barker is an engineer, a professor and an author. Currently he is Sr Manager of Web Development at Comcast, and an instructor at Philadelphia University. He has authored several books on web development including Pro JavaScript Performance: Monitoring and Visualization, and Pro Data Visualization with JavaScript and R.Matthew Campbell has worked on data visualization and dashboards with a data science team using RStudio. He got his start with technology after college when he learned SAS to do statistical programming at the Educational Testing Service (ETS). Learning this programming language kicked off a lifelong obsession with technology. Read more |
| الكاتب | Tom Barker |
| اللغة | English |
| عدد الصفحات | 292 pages |


![/electronics-and-mobiles/mobiles-and-accessories/mobiles-20905/smartphones/honor/?sort[by]=best_rating&sort[dir]=desc&limit=50&page=1&isCarouselView=false](https://a.nooncdn.com/cms/pages/20250811/honor/en_uae_dk-nav-01.png)


![/fashion-men/jack_jones/?sort[by]=popularity&sort[dir]=desc&limit=50](https://a.nooncdn.com/cms/pages/20240305/4ef48af441e2b44cea1673cd2e4aff67/en_dk-men-brands-04.png)


![/fashion-men/seventy_five/?sort[by]=popularity&sort[dir]=desc&limit=50](https://a.nooncdn.com/cms/pages/20240305/4ef48af441e2b44cea1673cd2e4aff67/en_dk-womens-new-brands-01.png)
![/fashion-men/skechers/?sort[by]=popularity&sort[dir]=desc&limit=50](https://a.nooncdn.com/cms/pages/20240305/4ef48af441e2b44cea1673cd2e4aff67/en_dk-womens-new-brands-02.png)


![/fashion-women/mango/?sort[by]=popularity&sort[dir]=desc&limit=50](https://a.nooncdn.com/cms/pages/20240305/4ef48af441e2b44cea1673cd2e4aff67/en_dk-women-brands-05.png)
![/fashion-women/guess/?sort[by]=popularity&sort[dir]=desc&limit=50](https://a.nooncdn.com/cms/pages/20240305/4ef48af441e2b44cea1673cd2e4aff67/en_dk-women-brands-09.png)


![/fashion-women/ella/?sort[by]=popularity&sort[dir]=desc&limit=50](https://a.nooncdn.com/cms/pages/20241812/en_dk-nav-brands-01.png)
![/fashion-women/skechers/?sort[by]=popularity&sort[dir]=desc&limit=50](https://a.nooncdn.com/cms/pages/20241812/en_dk-nav-brands-02.png)


![/fashion/view-all-kids-clothing/nike/?sort[by]=popularity&sort[dir]=desc&limit=50](https://a.nooncdn.com/cms/pages/20240911/nav-web/en_mb_uae_brand-01.png)
![/fashion/view-all-kids-clothing/disney/disney_minnie_mouse/disney_frozen/disney_princess/disney_mickey_mouse/disney_baby/?sort[by]=popularity&sort[dir]=desc&limit=50](https://a.nooncdn.com/cms/pages/20240911/nav-web/en_mb_uae_brand-03.png)


![/fashion/view-all-kids-clothing/new_balance/?sort[by]=popularity&sort[dir]=desc&limit=50](https://a.nooncdn.com/cms/pages/20240911/nav-web/en_mb_uae_brand-11.png)


![/music-movies-and-tv-shows/musical-instruments-24670/pianos-keyboards-synthesizers/chloris/?sort[by]=popularity&sort[dir]=desc&limit=50&page=1&isCarouselView=false](https://f.nooncdn.com/cms/pages/20250407/books-nav/en_uae_dk-nav-brands-04.png)
![/music-movies-and-tv-shows/musical-instruments-24670/pianos-keyboards-synthesizers/roland/?sort[by]=popularity&sort[dir]=desc&limit=50&page=1&isCarouselView=false](https://f.nooncdn.com/cms/pages/20250407/books-nav/en_uae_dk-nav-brands-05.png)
![/music-movies-and-tv-shows/musical-instruments-24670/pianos-keyboards-synthesizers/donner/?sort[by]=popularity&sort[dir]=desc&limit=50&page=1&isCarouselView=false](https://f.nooncdn.com/cms/pages/20250407/books-nav/en_uae_dk-nav-brands-06.png)
![/music-movies-and-tv-shows/musical-instruments-24670/pianos-keyboards-synthesizers/korg/?sort[by]=popularity&sort[dir]=desc&limit=50&page=1&isCarouselView=false](https://f.nooncdn.com/cms/pages/20250407/books-nav/en_uae_dk-nav-brands-07.png)