• usp_easy_retunsاسترجاع مجاني وسهل
  • usp_best_dealsأفضل العروض
placeholder
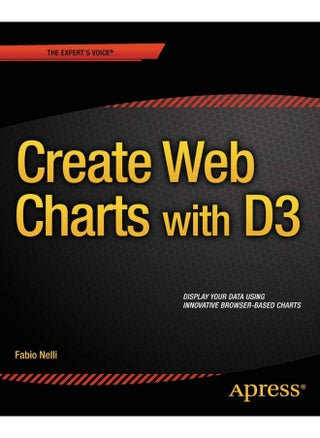
Create Web Charts with D3
magnifyZoom

Create Web Charts with D3

212.00
noon-marketplace
احصل عليه خلال 13 يوليو
اطلب في غضون 9 ساعة 2 دقيقة

خصم على الدفع

placeholder
/emkan/
نظرة عامة على المنتج

المواصفات

الناشرApress; 1st ed. edition
رقم الكتاب المعياري الدولي 101484208668
تنسيق الكتابPaperback
وصف الكتابCreate Web Charts with D3 shows how to convert your data into eye-catching, innovative, animated, and highly interactive browser-based charts. This book is suitable for developers of all experience levels and needs: if you want power and control and need to create data visualization beyond traditional charts, then D3 is the JavaScript library for you.By the end of the book, you will have a good knowledge of all the elements needed to manage data from every possible source, from high-end scientific instruments to Arduino boards, from PHP SQL databases queries to simple HTML tables, and from Matlab calculations to reports in Excel. This book contains content previously published in Beginning JavaScript Charts.Create all kinds of charts using the latest technologies available on browsersFull of step-by-step examples, Create Web Charts with D3 introduces you gradually to all aspects of chart development, from the data source to the choice of which solution to apply.This book provides a number of tools that can be the starting point for any project requiring graphical representations of data, whether using commercial libraries or your own
تاريخ النشر20 November 2014
رقم الكتاب المعياري الدولي 139781484208663
الكاتبFabio Nelli
اللغةEnglish
عن المؤلفFabio Nelli, is an IT Scientific Application Specialist at IRBM Science Park, a private research center in Pomezia, Roma (Italy). He has beena computer consultant for many years at IBM, EDS, Merck Sharp, and Dohme, along with several banks and insurance companies.He has an Organic Chemistry degree and many years of experience in Information technologies and Automation systems applied to Life Sciences (Tech Specialist at Beckman Coulter Italy and Spain).He is currently developing Java applications that interface Oracle databases with scientific instrumentations generating data and web server applications providing analysis of the results to researchers in real time.
عدد الصفحات316 pages
مجموع السلة  212.00
placeholder
Create Web Charts with D3
212.00
212
0

نحن دائماً جاهزون لمساعدتك

تواصل معنا من خلال أي من قنوات الدعم التالية:

تسوق أينما كنت

App StoreGoogle PlayHuawei App Gallery

تواصل معنا

madamastercardvisatabbytamaraamexcod
شركة حلول نون للتسويق الالكتروني شركة شخص واحد ش.ذ.م.م1010703009 السجل التجاري302004655210003 الرقم الضريبي