| وصف الكتاب | SAS ODS graphics users will learn in this book how to visually understand and communicate the significance of data to deliver images for quick and easy insight, with precise numbers. Many charts or plots require the viewer to run the eye from a bar end or plot point to some point on an axis, and then to interpolate between tick marks to estimate the value. Some design choices can lead to wrong conclusions or mistaken impressions. Graphic software relies on defaults to deliver something if you make a minimal effort, but that something is not likely to be exactly what you want. Visual Data Insights Using SAS ODS Graphics provides examples using experience-based design principles. It presents examples of bar charts, pie charts, and trend lines or time series plots, the graph types commonly used in business, other organizations, and the media for visual insight into data. Newer graphs are also included: dot plots, needle plots, waterfall charts, butterfly charts, heat maps, bubble plots, step plots, high-low plots, and donut charts. In addition, there are basic tools of statistics: scatter plots, box plots, histograms, fit and confidence plots, and distributions. Author LeRoy Bessler introduces unique creations, including sparsely annotated time series, maximally informative bar charts, better box plots, histograms based on interesting atypical rationales, and much more.The examples use SAS sample data sets as input. Any SAS user can experiment with the code presented to see what else is possible, or adapt it to repurpose the design and apply it with a customized version of that code.What You’ll LearnCreate graphs that are easily and quickly interpreted, and without ambiguitySupply precise data values that are correct on the graph and correctly associated with the graphic visual elementsTake advantage of widely applicable (but not necessarily available elsewhere) design examplesAvoid bad practices that are encouraged by poor examples elsewhereGet past sub-optimal designs and results that are built into software defaultsTake advantage of less familiar capabilities available in the softwareWho This Book Is ForSAS software users who want to understand their data and/or visually deliver their results |
 استرجاع مجاني وسهل
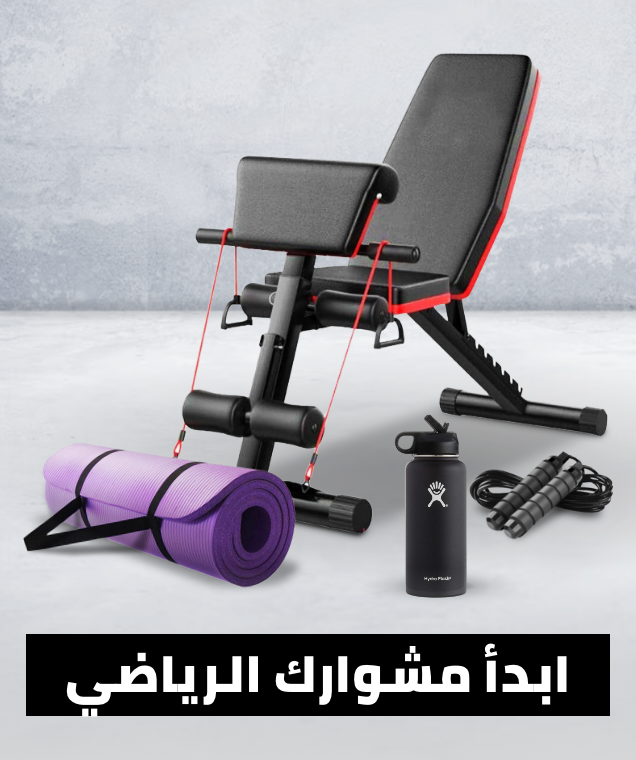
 أفضل العروض


![/fashion-men/jack_jones/?sort[by]=popularity&sort[dir]=desc&limit=50](https://a.nooncdn.com/cms/pages/20240305/4ef48af441e2b44cea1673cd2e4aff67/en_dk-men-brands-04.png)


![/fashion-men/seventy_five/?sort[by]=popularity&sort[dir]=desc&limit=50](https://a.nooncdn.com/cms/pages/20240305/4ef48af441e2b44cea1673cd2e4aff67/en_dk-womens-new-brands-01.png)
![/fashion-men/skechers/?sort[by]=popularity&sort[dir]=desc&limit=50](https://a.nooncdn.com/cms/pages/20240305/4ef48af441e2b44cea1673cd2e4aff67/en_dk-womens-new-brands-02.png)


![/fashion-women/mango/?sort[by]=popularity&sort[dir]=desc&limit=50](https://a.nooncdn.com/cms/pages/20240305/4ef48af441e2b44cea1673cd2e4aff67/en_dk-women-brands-05.png)
![/fashion-women/guess/?sort[by]=popularity&sort[dir]=desc&limit=50](https://a.nooncdn.com/cms/pages/20240305/4ef48af441e2b44cea1673cd2e4aff67/en_dk-women-brands-09.png)


![/fashion-women/ella/?sort[by]=popularity&sort[dir]=desc&limit=50](https://a.nooncdn.com/cms/pages/20241812/en_dk-nav-brands-01.png)
![/fashion-women/skechers/?sort[by]=popularity&sort[dir]=desc&limit=50](https://a.nooncdn.com/cms/pages/20241812/en_dk-nav-brands-02.png)


![/fashion/view-all-kids-clothing/nike/?sort[by]=popularity&sort[dir]=desc&limit=50](https://a.nooncdn.com/cms/pages/20240911/nav-web/en_mb_uae_brand-01.png)
![/fashion/view-all-kids-clothing/disney/disney_minnie_mouse/disney_frozen/disney_princess/disney_mickey_mouse/disney_baby/?sort[by]=popularity&sort[dir]=desc&limit=50](https://a.nooncdn.com/cms/pages/20240911/nav-web/en_mb_uae_brand-03.png)


![/fashion/view-all-kids-clothing/new_balance/?sort[by]=popularity&sort[dir]=desc&limit=50](https://a.nooncdn.com/cms/pages/20240911/nav-web/en_mb_uae_brand-11.png)


![/baby-products/momcozy/?f[partner][]=p_9404&sort[by]=popularity&sort[dir]=desc&limit=50&page=1&isCarouselView=false&av=0](https://a.nooncdn.com/cms/pages/20241031/navrev-baby/en_uae_dk-nav-04.png)


![/music-movies-and-tv-shows/musical-instruments-24670/pianos-keyboards-synthesizers/roland/?sort[by]=popularity&sort[dir]=desc&limit=50&page=1&isCarouselView=false](https://f.nooncdn.com/cms/pages/20250407/books-nav/en_uae_dk-nav-brands-05.png)
![/music-movies-and-tv-shows/musical-instruments-24670/pianos-keyboards-synthesizers/mike_music/?sort[by]=popularity&sort[dir]=desc&limit=50&page=1&isCarouselView=false](https://f.nooncdn.com/cms/pages/20250407/books-nav/en_ksa_dk-nav-brands-04.png)


